
Загрузка...
ABOUT THE PRODUCT
Ready Medicines
Food Supplements
Products for Medical Use
Baby Food
Products for Mother and Child
Personal Hygiene
Treatment Cosmetics
Barrier Contraception
Phytogenous Drug Crude
The product includes 9 product categories
VI-SCOPE: PHARMACY CHAIN SALESSystem of Power BI dashboards with updates every 10 days. Reports are built on the basis of pharmacy sales data to end consumers. Complete analytics by product categories, brands and regions helps make informed strategic decisions.
TYPES OF COMPREHENSIVE ANALYSIS
Sales Analysis
Description- •Visual comparison of market and pharmacy chain indicators across 9 product categories
- •Covers market share by INN, corporations, ATC3, brands and SKU
- •Analysis by 17 regions and 4 cities
Sales Comparison
Description- •Pharmacy chain sales dynamics in tabular format
- •Assessment by amounts and packages by brands, INN, corporations
- •Geography: Kazakhstan, 17 regions and 4 cities
Pharmacy Chain Metrics Analysis
Description- •Convenient visualization of key Sell Out data
- •Assessment of data by brands, INN, geography and corporations
- •Geography: Kazakhstan, 17 regions and 4 cities
Data Sources
№1 in market coverage
Data Processing Methodology
The product uses a unique methodology, taking into account the market conditions of Kazakhstan
Input
Checking completeness and quality of incoming data. Monthly data input in electronic form. Direct integration with pharmacies. Detailed sales data by pharmacy points
Classification of shipment points
Standardization of pharmacy points according to internal directories
Matching
Matching of drugs, name spellings, pharmaceutical companies according to internal directories and state registry
Extrapolation
Extrapolation at the regional level. Methodology approved by Vi-ORTIS company analysts
Quality Control
Comparison of the total amount of the source file with the final data after processing and recalculation. Checking TOP-30 goods by key parameters: amount and number of packages
VI-SCOPE: PHARMACY CHAIN SALEScomplete picture without unnecessary complexity
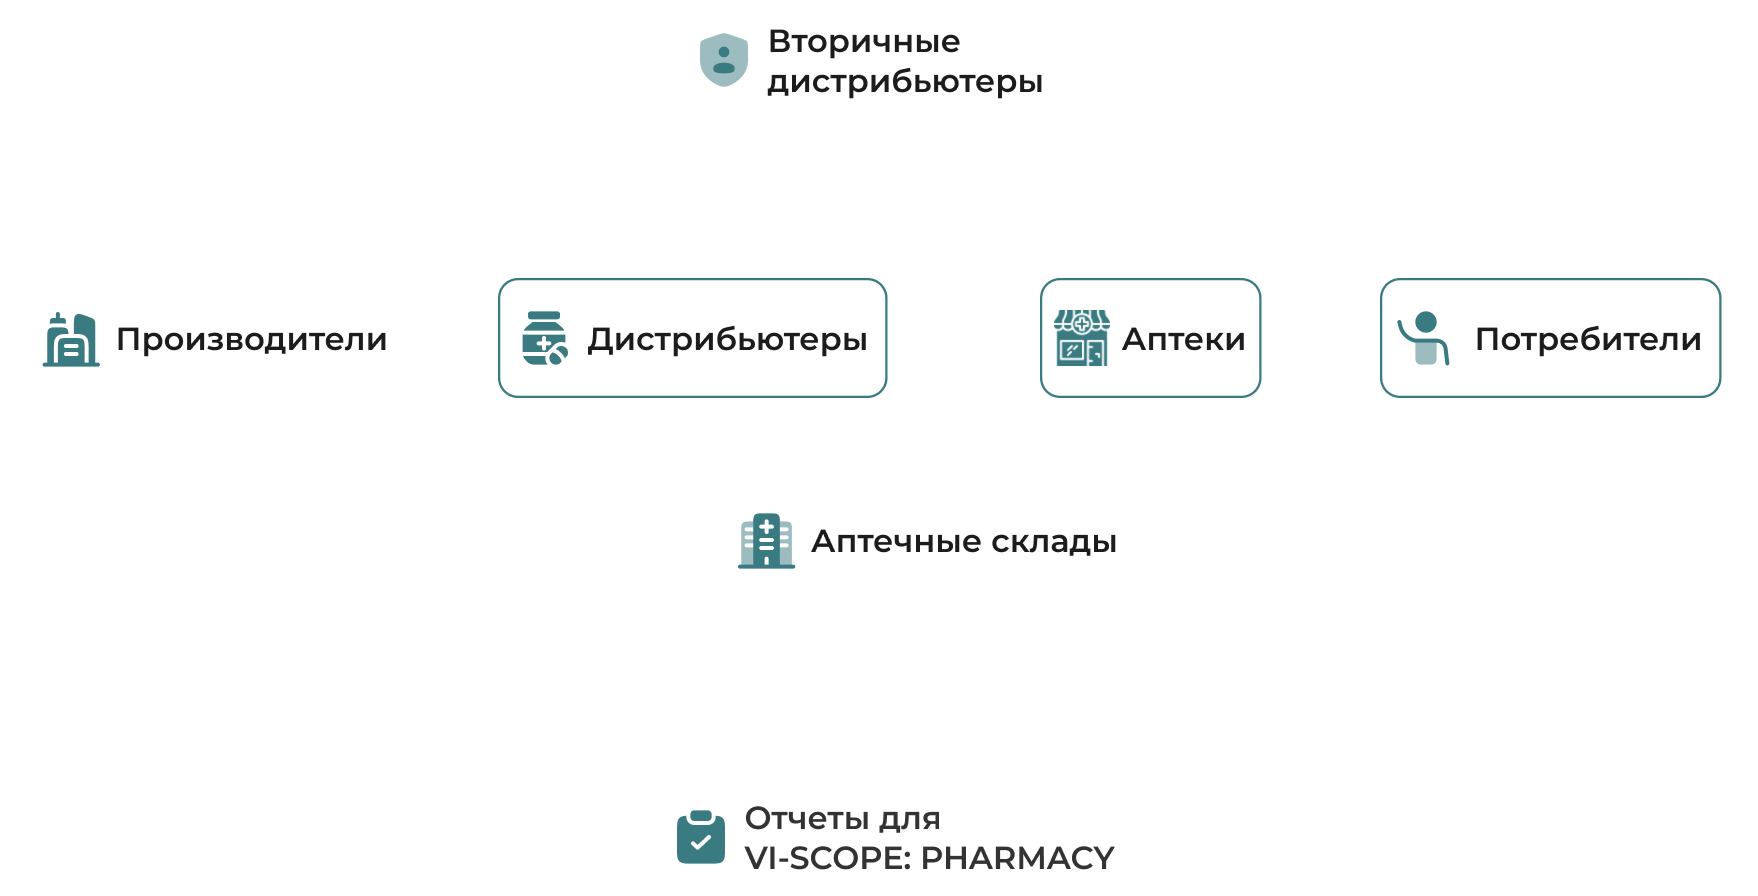
Goods movement scheme
The product displays data on the number of drugs purchased by the population in pharmacies

Technical Specifications
- Periods: decade, month, quarter, year, YTD, MAT, half year.
- Indicators: amount/packages.
- Data type: consolidated.
- Sales by 9 product categories (market/distributor).
- Classifications: corporation, INN, ICD, ATC3, brand, SKU.
- Analysis by regions (17) and cities (4).
- Procurement dynamics by months.
- Assessment of pharmacy chain indicators by brands, geography and corporations.
- Growth by INN, ATC3, ICD and corporations (in amounts and volumes).
- Excel, PowerPoint, PDF.
Загрузка видео...
Analytical and IT EcoSystem of Vi-ORTIS Products
Vi-ORTIS is the only local provider of a full range of analytical and IT services for the pharmaceutical market.
Advantages
Service
- Microsoft Power BI integration
- Personal technical manager
- Quarterly Pharmaceutical Market REVIEWS
- Data archive for 5 years
Accuracy
- More than 75% of the market
- №1 in Kazakhstan
Geography
- Country
- 17 regions
- 18 cities
Speed
- Monthly – 15 days after the end of the period
- №1 in Kazakhstan
Methodology
- VI-SCOPE uses a unique methodology, taking into account the market conditions of Kazakhstan
Price
- Flexible pricing policy
- Vi-ORTIS products are a constructor.
Working with us
Loading news...
Загрузка...