VI-SCOPE PHARMACY
CHAIN SALES
VI-SCOPE: PHARMACY CHAIN SALES — a platform for analyzing pharmacy chain data with the integration of pharmacy sales indicators. The system provides dashboards in Power BI with an update every 10 days. Manage the network strategy with accurate data on geography, products and classifications.

Speed monthly/decadally
#1 in Kazakhstan

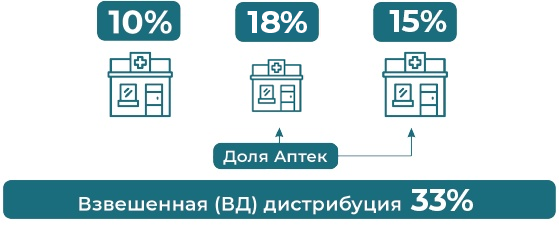
Accuracy more than 75% market
#1 in Kazakhstan

Geography – analytics available by country, region and city

Convenience - ready-made dashboards in Power BI with a simple interface

Integration - the ability to export data to Excel, PowerPoint and PDF
VI-SCOPE PHARMACY
CHAIN SALES
Pharmacy chains work with large volumes of sales and purchase data on a daily basis, but without integrating market indicators, it is difficult to assess their positions and efficiency. Disparate data, complex tables and lack of analytics make it difficult to make strategic decisions.
Vi-ORTIS simplifies your work by combining all data in one dashboard for fast and accurate analysis.
VI-SCOPE: PHARMACY CHAIN SALES analysis answers key questions for pharmacy chains:

What share does my network occupy in different product categories?
Which regions are showing growth or decline in sales?
How do seasonal factors affect demand and sales?
Which brands and categories are performing best?
Are my sales dynamics in line with market trends?
How successful were the marketing activities carried out?


1. Input
- Checking the quality and completeness of the received data
- Monthly data entry in electronic form
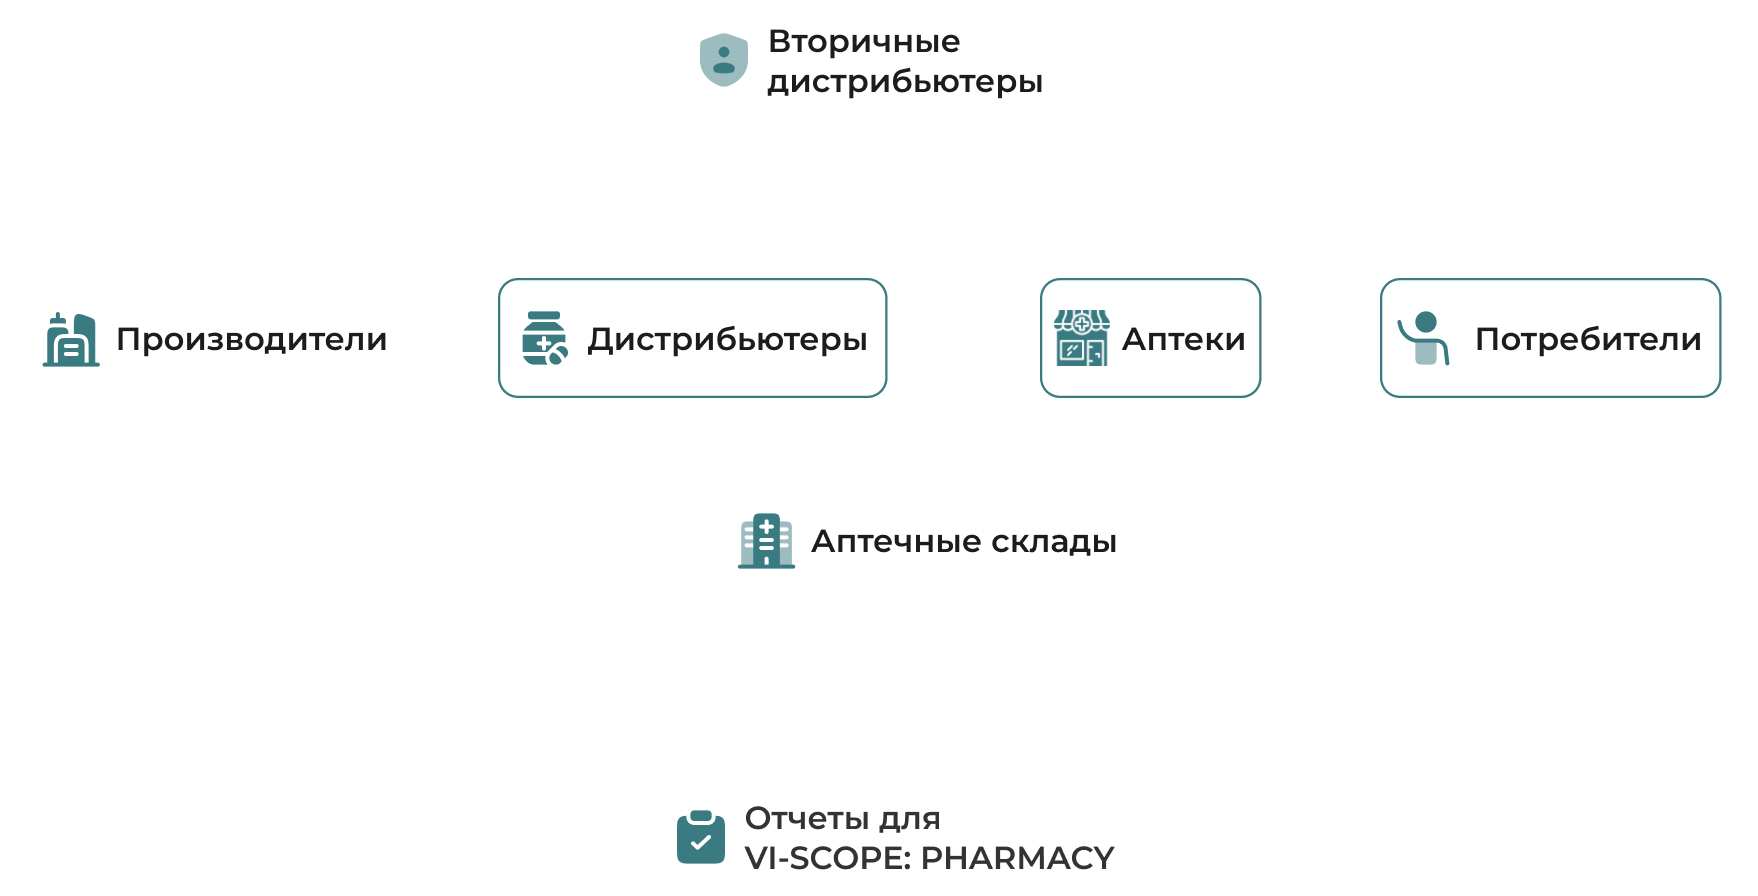
- Direct integration with pharmacies
- Sales details for drugstores

2. Classification of shipping points
- Standardization of pharmacy outlets according to internal reference books

3. Comparison
- Comparison of drugs, spelling of names, manufacturers according to internal reference books and the state register

4. Extrapolation
- Extrapolation at the regional level
- The methodology has been approved by analysts at Vi-Ortis

5. Quality control
- Comparison of the total amount of the original file with the final data after processing and recalculation
- Checking the TOP-30 products by key parameters: amount and number of packages


Service
- Microsoft Power BI integration
- Personal technical manager
- Quarterly Pharmaceutical Market REVIEWS
- 5 years of data archive
Accuracy
- Over 75% market
#1 in Kazakhstan
Geography
- Country
- 17 regions
- 18 cities
Speed
- Monthly - 15 days after the end of the period
#1 in Kazakhstan
Methodology
- VI-SCOPE PHARMACY CHAIN SALES uses a unique methodology, taking into account the market conditions of Kazakhstan
Price
- Flexible pricing policy
- Vi-ORTIS products are a constructor.
WE ARE TRUSTED