VI-SCOPE
DISTRIBUTOR SALES
VI-SCOPE: DISTRIBUTOR SALES is a Power BI-based platform for analyzing distributor data and comparing it with market indicators. Every ten days, updates and convenient dashboards allow you to quickly identify trends and make accurate decisions. An ideal tool for strategic planning and work optimization.

Speed monthly/decadally
#1 in Kazakhstan

Accuracy more than 91% market
No. 1 in the EAEU

Geography – analytics available by country, region and city

Convenience - ready-made dashboards in Power BI with a simple interface

Integration - the ability to export data to Excel, PowerPoint and PDF
VI-SCOPE
DISTRIBUTOR SALES
Distributors regularly analyze their sales and processes, but without access to market data, it is difficult to see the full picture. Disparate sources and multiple Excel files complicate the work and reduce efficiency.
Vi-ORTIS brings all data together in one place, providing quick access to analytics and market dynamics.
The VI-SCOPE: DISTRIBUTOR SALES analysis provides answers to key questions:

How does a distributor perform in different product categories?
What changes are occurring in sales by region?
How do seasonal factors affect the market and my sales?
What is my share in the manufacturer's portfolio (by category, brand, INN, ATX3)?
Does the market dynamics match my sales for the selected period?
How effective are the marketing activities carried out?


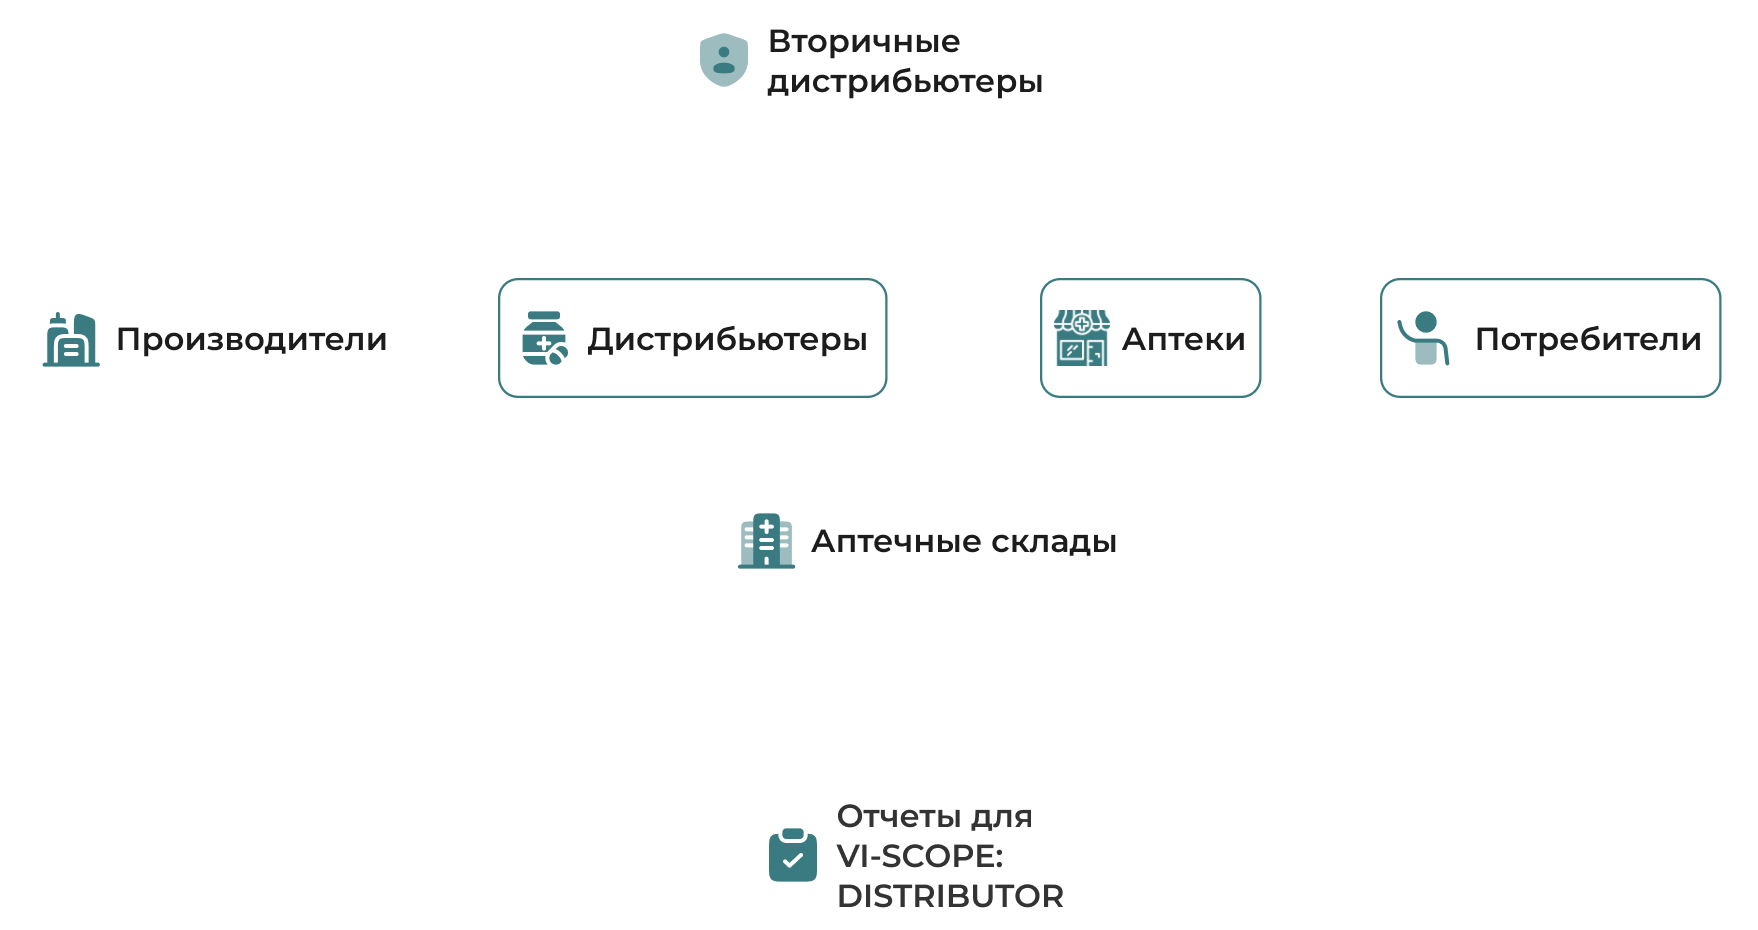
1. Information processing
- Checking the completeness and quality of the information provided
- Preparation of a unified format for recording in the VI-PRO module. Automated primary processing

2. Primary processing
- Combine data from all sources into a single report to provide holistic analysis
- Comparison of counterparties and goods based on standard reference books of the Vi-ORTIS company

3. Secondary processing
- Automatic conversion of data from units (tablet, ampoule, etc.) to packaging to standardize information
- Individually quantifying products such as vaccines and blood products into dosage-based packages

4. Extrapolation
- Extrapolation of data at the regional level using the approved methodology of Vi-ORTIS analysts

5. Quality control
- Comparison of the total amount of the original file with the final data after processing and recalculation
- Checking the TOP-30 products by key parameters: amount and number of packages


Service
- Microsoft Power BI integration
- Personal technical manager
- Quarterly Pharmaceutical Market REVIEWS
- 5 years of data archive
Accuracy
- More than 91% market
No. 1 in the EAEU
Geography
- Country
- 17 regions
- 18 cities
Speed
- Monthly - 12 days after the end of the period
- Every ten days - on the 6th day after the end of the period
#1 in Kazakhstan
Methodology
- VI-SCOPE DISTRIBUTOR SALES uses a unique methodology, taking into account the market conditions of Kazakhstan
Price
- Flexible pricing policy
- Vi-ORTIS products are a constructor.
WE ARE TRUSTED